Elevated language: Yvaine Neyhard FP’20 and the topography of Hamlet

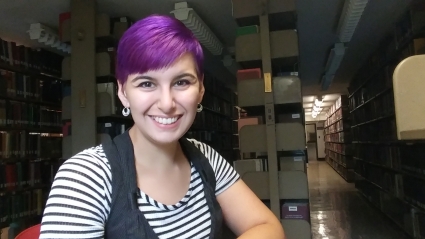
Frances Perkins Scholar Yvaine Neyhard’s FP’20 interest in Mount Holyoke’s Makerspace was initially piqued by a sweet tooth — and the chocolate-making workshops that started back when the space occupied a much smaller footprint in Art 211.
“I wasn’t able to attend any of those workshops,” she says, “but their existence showed me that the Makerspace was a place for more than just circuit boards and robotics.”
That impression was reinforced when Makerspace Coordinator Shani Mensing ’15 — now the Fimbel Maker & Innovation Lab Coordinator — gave Neyhard a tour in the summer of 2017.
“As we walked around,” Neyhard says, “I noticed that the ‘non-technical’ crafts often blended with ‘technical’ skills, equipment and resources. There were geometric, molded paper figures that had obviously been designed in CAD (computer aided design), and some small 3D sculptures that had been cut out with the laser cutter, painted and fitted with lights attached to a small circuit board. But I also saw sewing machines, paints, woodworking supplies and paper crafts.”
Neyhard became even more familiar with the space when, during a term as social chair of Frances Perkins Scholars Association, she hosted a pair of events there. The following semester, prompted by an academic assignment that called for a creative response, she seized an opportunity to combine her interests in geology and literature.
What inspired you to take advantage of the resources in the Makerspace?
The assignment itself was for Associate Professor of English and Senior Class Dean Amy Rodgers’ “Activist Shakespeare” class, and it was pretty open-ended. It was basically, come up with some project related to Shakespeare that is activist in nature. I want to go into teaching — at the time it was high school, but now I’m more interested in the college level — so I’m always thinking about curriculum, how to make things engaging for students and how to engage people who don’t gravitate toward the material. At the high school and college level, some exposure to Shakespeare is pretty much a requirement, and most people are really resistant to it, because it’s old, and it seems out of place and archaic and kind of boring. So, I was trying to think of different ways that I could make Shakespeare relevant to modern classes.
How did you connect that with making?
In addition to being an English major, I’m a geology minor, and I really love earth science and topographic maps. I was literally lying in bed one night, falling asleep, thinking about this final project, and I thought to myself, well, the lines called contour lines on a topographic map — those are just numbers. And then we sort of ascribe to them the value of elevation, so “200” means 200 meters above sea level. So why couldn’t I find some way to quantifiably analyze Shakespeare, and then take that number and interpret it as an elevation? I was thinking about that and I thought, “Oh, that’d be really fun, and then I could sort of create this landscape of the text and bring it into three dimensions.”
How did you decide what to measure?
I started thinking, this is something I want to do just for fun at this point, but how can I make it useful? What quantifiable metric could I draw from this text to create this landscape? And being interested in teaching, I thought comprehension would be an interesting thing to measure. So I designed a survey where I asked first-year Mount Holyoke students who had not yet taken an English class to read a short snippet from Hamlet — I picked Hamlet because it’s the Shakespeare play most often assigned in high school curriculums — and I gave them highlighters, and I said ,“as you’re reading through this text, highlight any words or phrases that you don’t understand, that you find confusing, that you couldn’t define — anything that feels like a speed bump. It could be a whole paragraph, it could be a single word, there are no right or wrong answers here.” I surveyed 27 students one evening in Blanchard, and then I more or less gave the same survey to faculty members in the English department; I gave them the same piece of text, and I said “highlight any words or phrases that you think first-year students who haven’t yet had a college-level English class might find challenging, confusing or would feel like a roadblock as they moved through the text.”
And those responses became the data for your map?
Yes. I fit the text into a mesh of equally sized squares so that each word or phrase landed in one or more boxes, so then a phrase like “pocky corses” in that particular piece of the Hamlet text would land in four boxes. The number of students who marked that as a problematic phrase correlated to a value. I think in that case it was 23 students out of 27 had marked “pocky corses” as “I have no idea what this is.” “Pocky corses” is basically diseased bodies — disgusting, rotted corpses. And what’s really cool about that particular phrase being so confusing to students is that it’s very vivid imagery, and because they don’t know that, and they can’t see it, it really deflates the text and makes it so much less interesting than Shakespeare wanted it to be. So it was a great case study phrase for my analysis here.
[Manager of the Geo-Processing Lab and Instructor in Geology and Geography] Eugenio Marcano helped me plug everything into ArcSoft, which is Geographic Information System software that you can use for all kinds of cool things in the geosciences. By taking those data points and transferring them from that mesh into the computer program, we were able to generate a digital 3D model [in which] the places where students had the lowest comprehension correlated to the highest elevation. Then I was able to generate a model of the student data and the faculty data and see where they agreed and disagreed, which highlighted some very interesting discrepancies.
What sorts of things did you find?
For one thing, students tended to think in words, and faculty tended to think in phrases. Students also highlighted a lot of Shakespearian contractions, whereas faculty undermarked those, relative to students. The final phrase in the piece of text that I selected was Horatio saying “e’en so,” and I think it was something like 22 students highlighted that, but only one out of six faculty members. So that was really interesting, and Amy Rodgers, my professor, said she wouldn’t have thought that contractions would be a sticking point. So that was useful for her.
How did you bring the Makerspace into it?
Once I had those 3D digital models, I was able to go to the Makerspace and 3D-print them, and then you actually have a physical model that — in my perfect world, if I were a teacher — would be a really cool lesson plan to do with a class of students. [With a project like this] now you’ve engaged the students who are interested in geosciences and 3D-printing and emerging technologies and data manipulation, and you’re also engaging tactile learners and visual learners, not just book learners. Because now you have an actual physical model where you can say, “This is Shakespeare. These mountains, these ridges, these valleys. This is Shakespeare. And what does all of this mean?”
What does all of this mean?
I’m still a little stuck on how practical it could be in most classrooms, because most classrooms don’t necessarily have access to geoscience technologies or a 3D printer! But I think as a case study, for me the take-home was that, if I, as a geek for geosciences, can somehow weave Shakespeare into that interest, then I think there are certainly ways to make Shakespeare interesting to students in their own niches. In the future I hope I can use this project as a model to help students engage with Shakespeare through their own interests, whether in computer science or football or tabletop gaming or dance — anything is possible.
—By Abe Loomis
Abe Loomis is a freelance writer based in western Massachusetts. Contact him at abe.loomis@gmail.com.
July 29, 2019


Leave a Reply